Predator Control & Monitoring
The majority of work we do to help kōkako and the wider Kaharoa ecosystem thrive involves:
Removing invasive predators through trapping and toxin programmes,
Regular pest monitoring to better understand the success of our control efforts, and
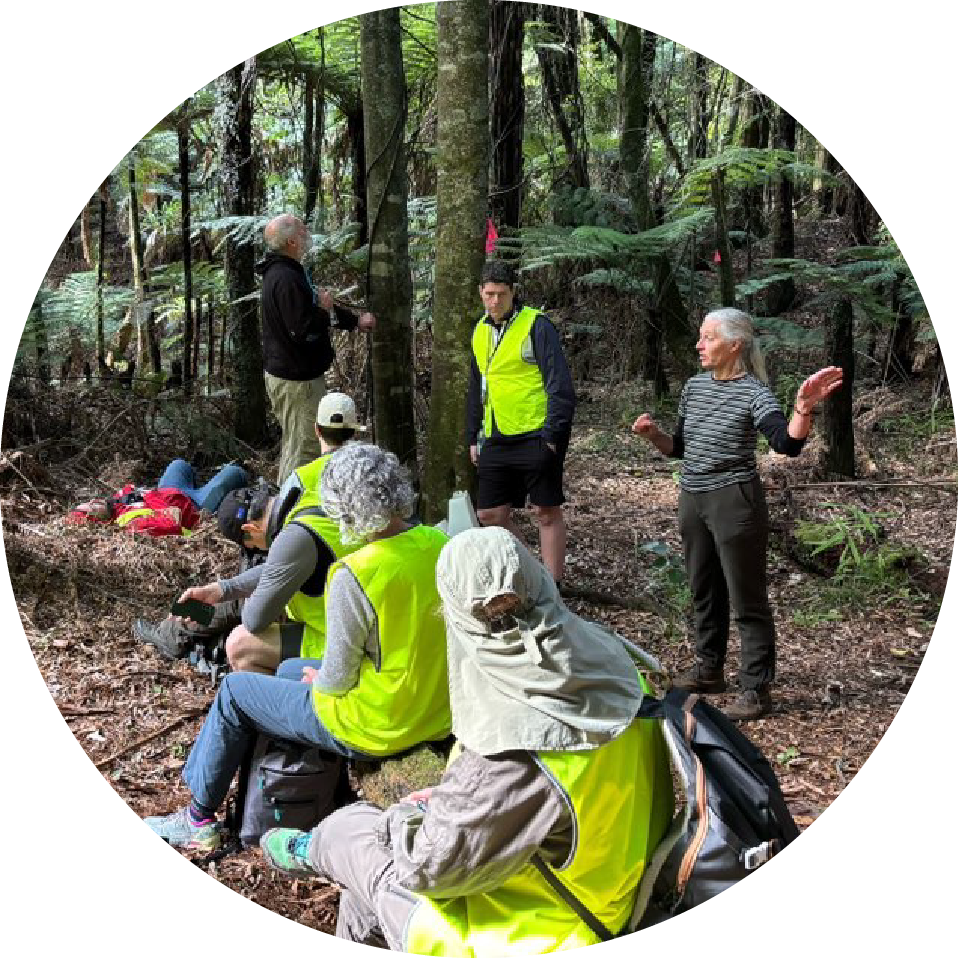
Species monitoring to identify changes to the presence and abundance of native birds and invertebrates.
Trapping
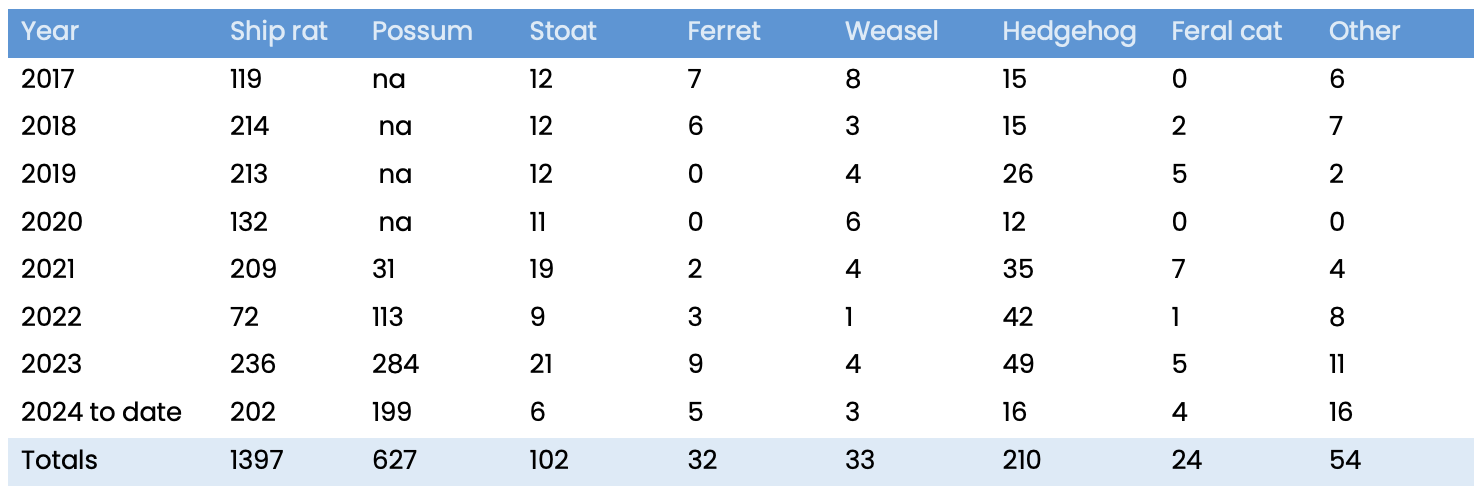
We maintain a variety of traps throughout the Kaharoa Conservation Area that require regular checks and lure refreshing. Around 90 DOC200 and DOC250 traps are used, and they are primarily aimed at targeting stoats but often catch other introduced predators like weasels, ferrets, ship rats, feral cats, and hedgehogs as secondary by-kill.
In addition to the stoat traps, we maintain around 80 Sentinel traps that are attached to trees to kill possums. We also have AT220 auto traps for more remote parts of the forest that are harder to regularly maintain.
Here’s an overview of our catch numbers since 2017. Other is mostly mice and rabbits.
Annual Pest Control Operations
The Trust carries out an annual pest control operation in spring, where toxin is placed in over 1400 bait stations distributed throughout the forest. Any remaining toxin is removed at the end of the operation. This work is carried out by a combination of contractors, local volunteers, and Tapuika iwi.
Toxin types are switched year-on-year to decrease the likelihood of bait shyness, and best practices such as pre-feeding rounds are implemented to increase the chances of success.
In 2024, an autumn pulse targeting ship rats was so successful that the Trust intends to continue with this application in future years.
Pest Monitoring
We use commonly accepted monitoring techniques to quantify the effectiveness of our annual pest control operations. This is done before and after each toxin application to assess changes in the number of ship rats and possums.
Tracking tunnels for ship rats
We have sixteen permanent tracking tunnel lines spread throughout the Kaharoa Conservation Area. Each tunnel consists of a rectangular coreflute box pegged into the ground, with open ends for rats to run through.
When they are in use, we place cards into the tunnels with inkpads in the middle and a lure (peanut butter for rodents) on the ends. Ship rats and other species are attracted to the food, then subsequently run through the tunnels.
When the cards are collected, we review the footprint marks on each inkpad to determine the types of species present and how abundant they are. Based on the data collected, we are then able to calculate a rat tracking index (RTI), which gives us a quantitative measure of rat density.
By measuring the RTI before and after toxin operations, we can measure the effectiveness of our efforts. To understand how ship rat numbers increase throughout the kōkako breeding season, we also carry out RTI assessments 6-, and 12-weeks post operation. For more information about tracking tunnels, check out this resource from the Department of Conservation.
Here’s a graph showing the RTI results before and after different types of toxin operations all the way back to 1990:
Key takeaways from this data are:
The years from 1990-1996 were part of a science project to understand the effect of pest control on kōkako breeding.
There are very significant differences in results depending on the toxin applied and the method. Compare the post-operation RTI data (blue columns) for aerial 1080 with the results following where ground-based applications in bait stations were used.
Gaps in data (e.g. 2010/2011) are due to a since-abandoned DoC policy of ‘pulsing’ applications (2 years on and 2 years off).
Results (post-operation data) have significantly improved in recent years with 0% in 2024.
Results from toxin applications depend on both the inherent toxin efficacy and the quality of the bait station network. Due to the challenging terrain, it is not possible to manage a complete coverage of bait station tracks. In some areas (like steep terrain), levels of pest control will not be as successful.
We are continually striving to improve our operations. At the time of publishing, this includes carrying out a staged infill of bait stations on all bait lines to reduce the gaps between stations from 100m to 50m. The success of this is indicated by recent results, as shown in the graph.
Wax tags for possums
In recent years, we have started using wax tags to understand the effectiveness of our possum control efforts. These wax tags are placed on lines throughout the Kaharoa Conservation Area, which the possums then proceed to investigate with a bite (there is no smell). By measuring the occurrence of possum bites on each wax tag and aggregating the data, we then calculate the bite mark index (BMI).
Traditionally, we used the residual trap catch index (RTCI or RTC). However, it is time-consuming and expensive and, therefore, wasn’t implemented as regularly as we would have liked - so we switched to the Bite Mark Index (BMI) method using wax tags in 2021. Wax tags are preferred over other BMI techniques, such as chew cards, as they leave no residual plastic waste in the forest.
This graph shows an overview of the possum monitoring results in Kaharoa since 1990:
Note the rapid increase in possum numbers following the 3 years of aerial applications from 1990 to 1992.
BMI is roughly double RTCI when possum numbers are relatively low. So the post-operation BMI of 9 in 2024 is around 4.5 RTCI equivalent.
Species Monitoring
We undertake a range of monitoring programmes to gain a better understanding of changes in the health of the Kaharoa ecosystem.
Full territorial adult kokako censuses are carried out at regular intervals.
Invertebrates are measured seasonally using Onduline artificial retreats.
Pekapeka-tou-roa/long-tailed bats are monitored during the summer when they are most active, using acoustic instruments.
Ruru/morepork numbers are assessed annually in October when they are the most vocal.
We also have a fenced-off area where we can measure differences in how the understory recovers without the pressure of seedlings being eaten by browsing ungulates.
Assessments are made of numbers by size at sites with para/king fern.
We use field cameras to record numbers of pest species (deer, pigs, goats, feral cats and mustelids).
We are planning to install vegetation plots to monitor ungulate browse.
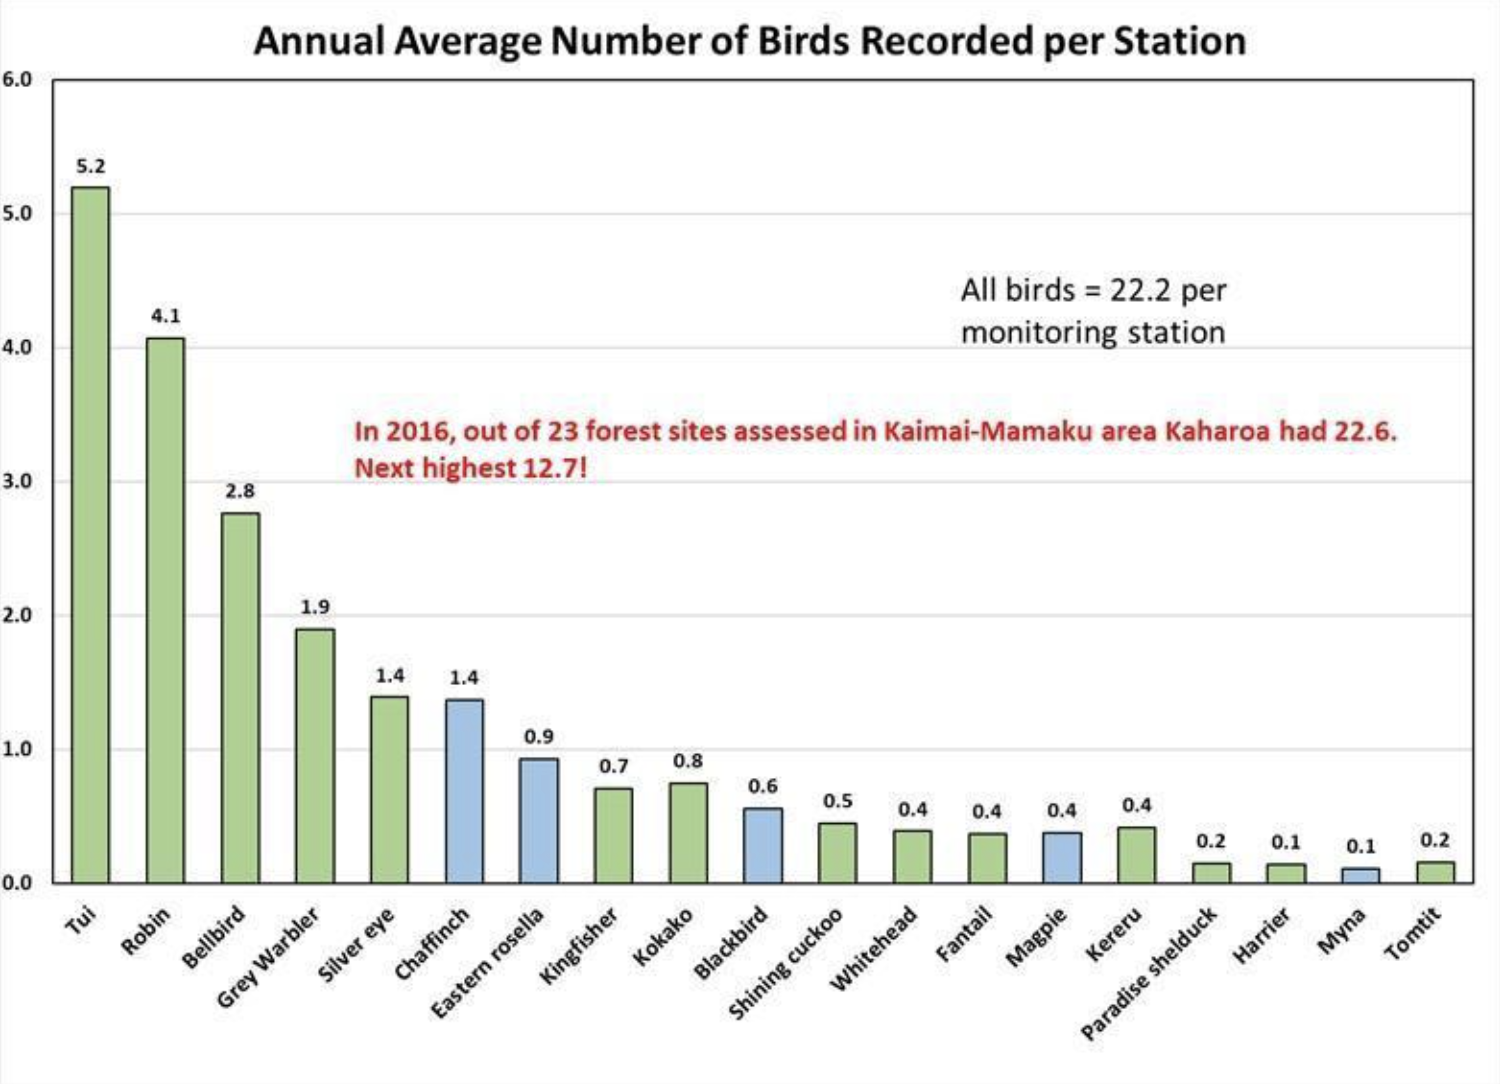
Forest bird numbers are assessed annually using the standard 5-minute bird count method.
This graph shows the average number of different species of birds recorded per listening station throughout Kaharoa during 5-minute bird counts, over 10 years of records:
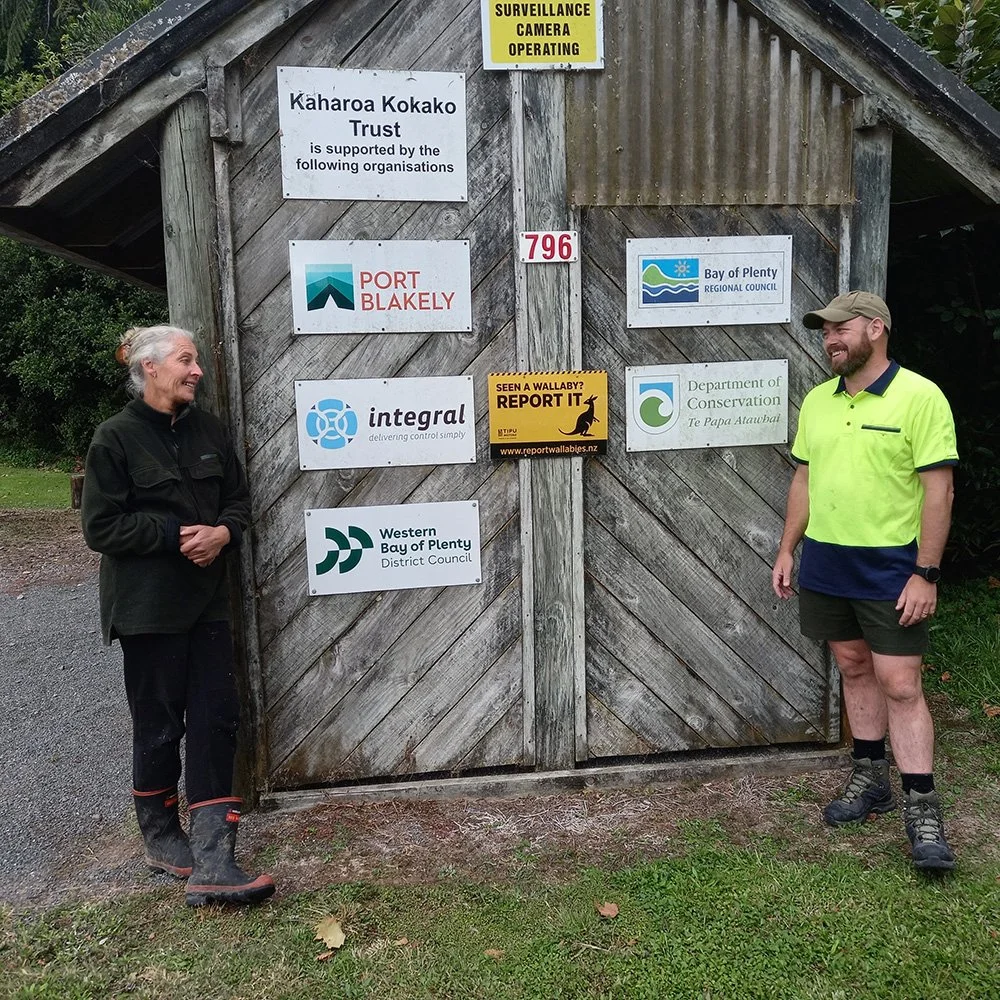
Get Involved
Our conservation mahi in Kaharoa Forest wouldn’t be possible without the support of our volunteers and funders. If you’re interested in getting involved and helping this beautiful ecosystem to flourish, we’d love to hear from you.
Support can come in many shapes and forms, depending on what suits you best. We welcome all offers of help - from a one-off donation or appearance at a volunteer day to applying for funding grants or deeper involvement such as ongoing hands-on trapping.
Click on the buttons below to learn more about how you can help.